The Satisfaction and Tickets reports
Reports has a tab for each. Both are on Pro and up; on Free they show sample data, so you can see what you’d get. The Conversations tab, on every plan, shows your satisfaction score too.
Satisfaction
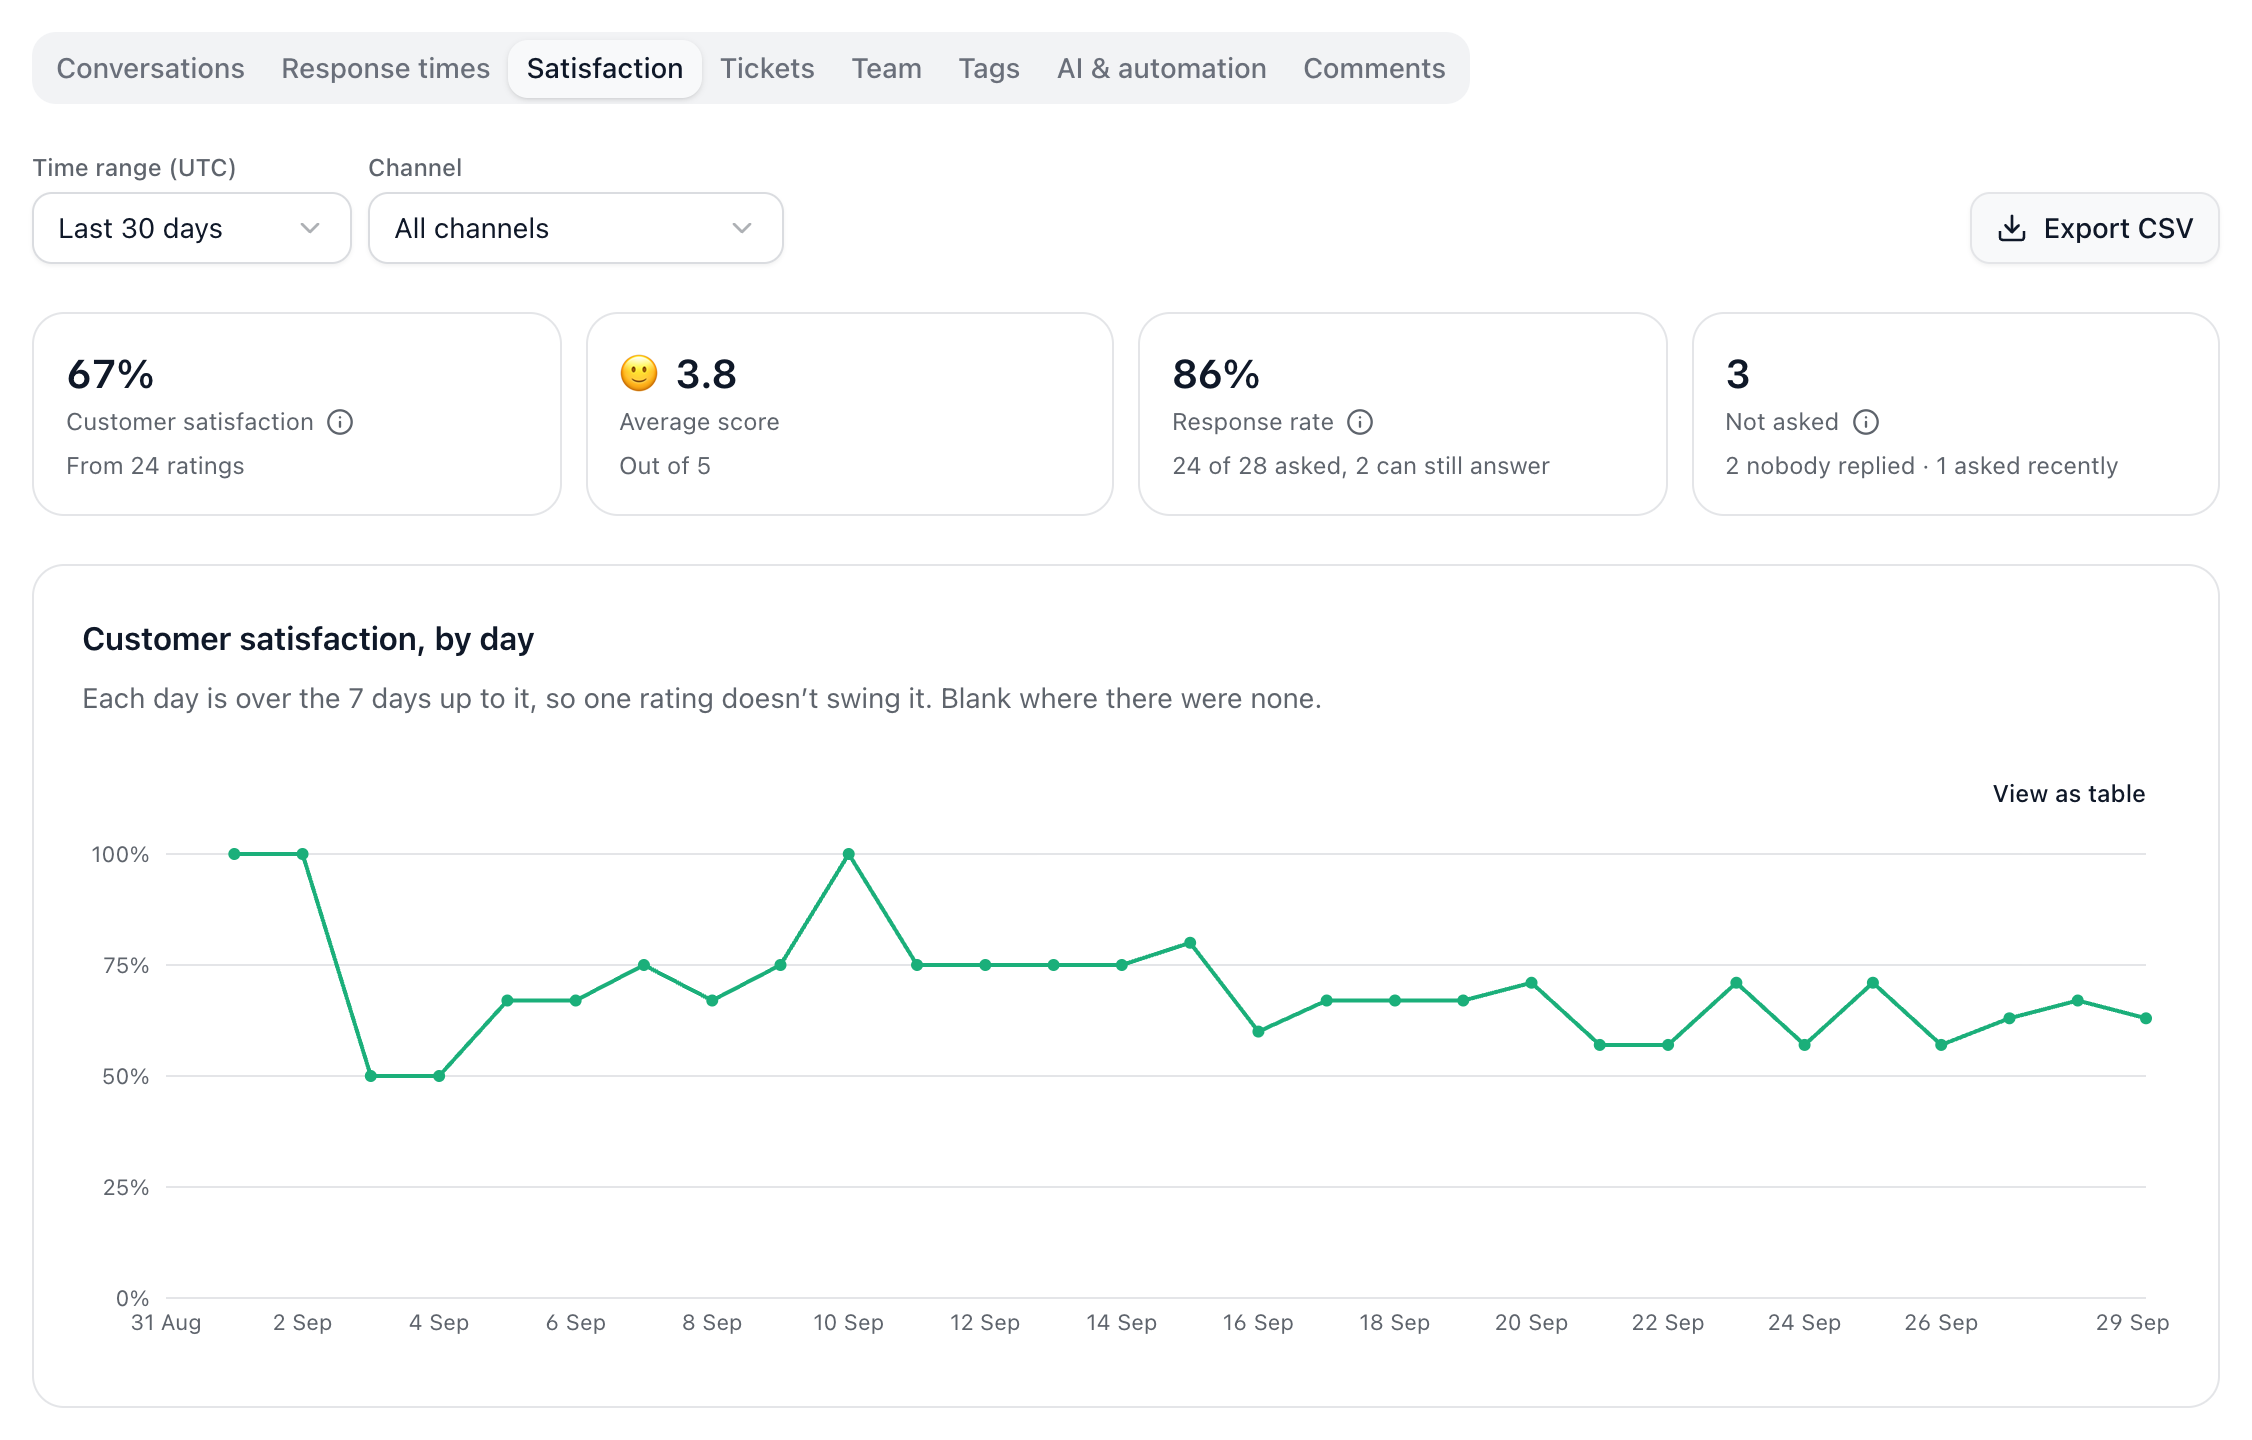
Customer satisfaction: the share of ratings that were Good or Great, with the average score and how many customers answered.
Conversations that weren’t asked, and why.
A trend, each day over the 7 days before it, so one rating doesn’t swing it.
Ratings by who answered (Dot alone, your team, or both), by teammate, by ticket type and by channel.
Every comment, newest first, each opening its conversation.
What low ratings were about: Dot groups the comments left with a 1 to 3 by what went wrong, in any language, with how many said each.
Tickets
Opened and resolved. Duplicates merged away are counted apart.
Time to resolve: the typical time (the median) and the slowest (the 90th percentile).
Resolved on time, against the due date. Time spent waiting on the customer never counts against you.
Overdue now and open now, with how many nobody has.
Opened and resolved by day, then by type and by who has them.
Choose Overdue now to open the board with just the overdue tickets. If none of your tickets have due dates, give your ticket types a target time in Settings → Tickets.
Did this answer your question?